Pokémon Go — Seeing the Forest Through the Trees
How Niantic can transform engines of seasonal fads into a persistent, player-driven business-behind-the-business.

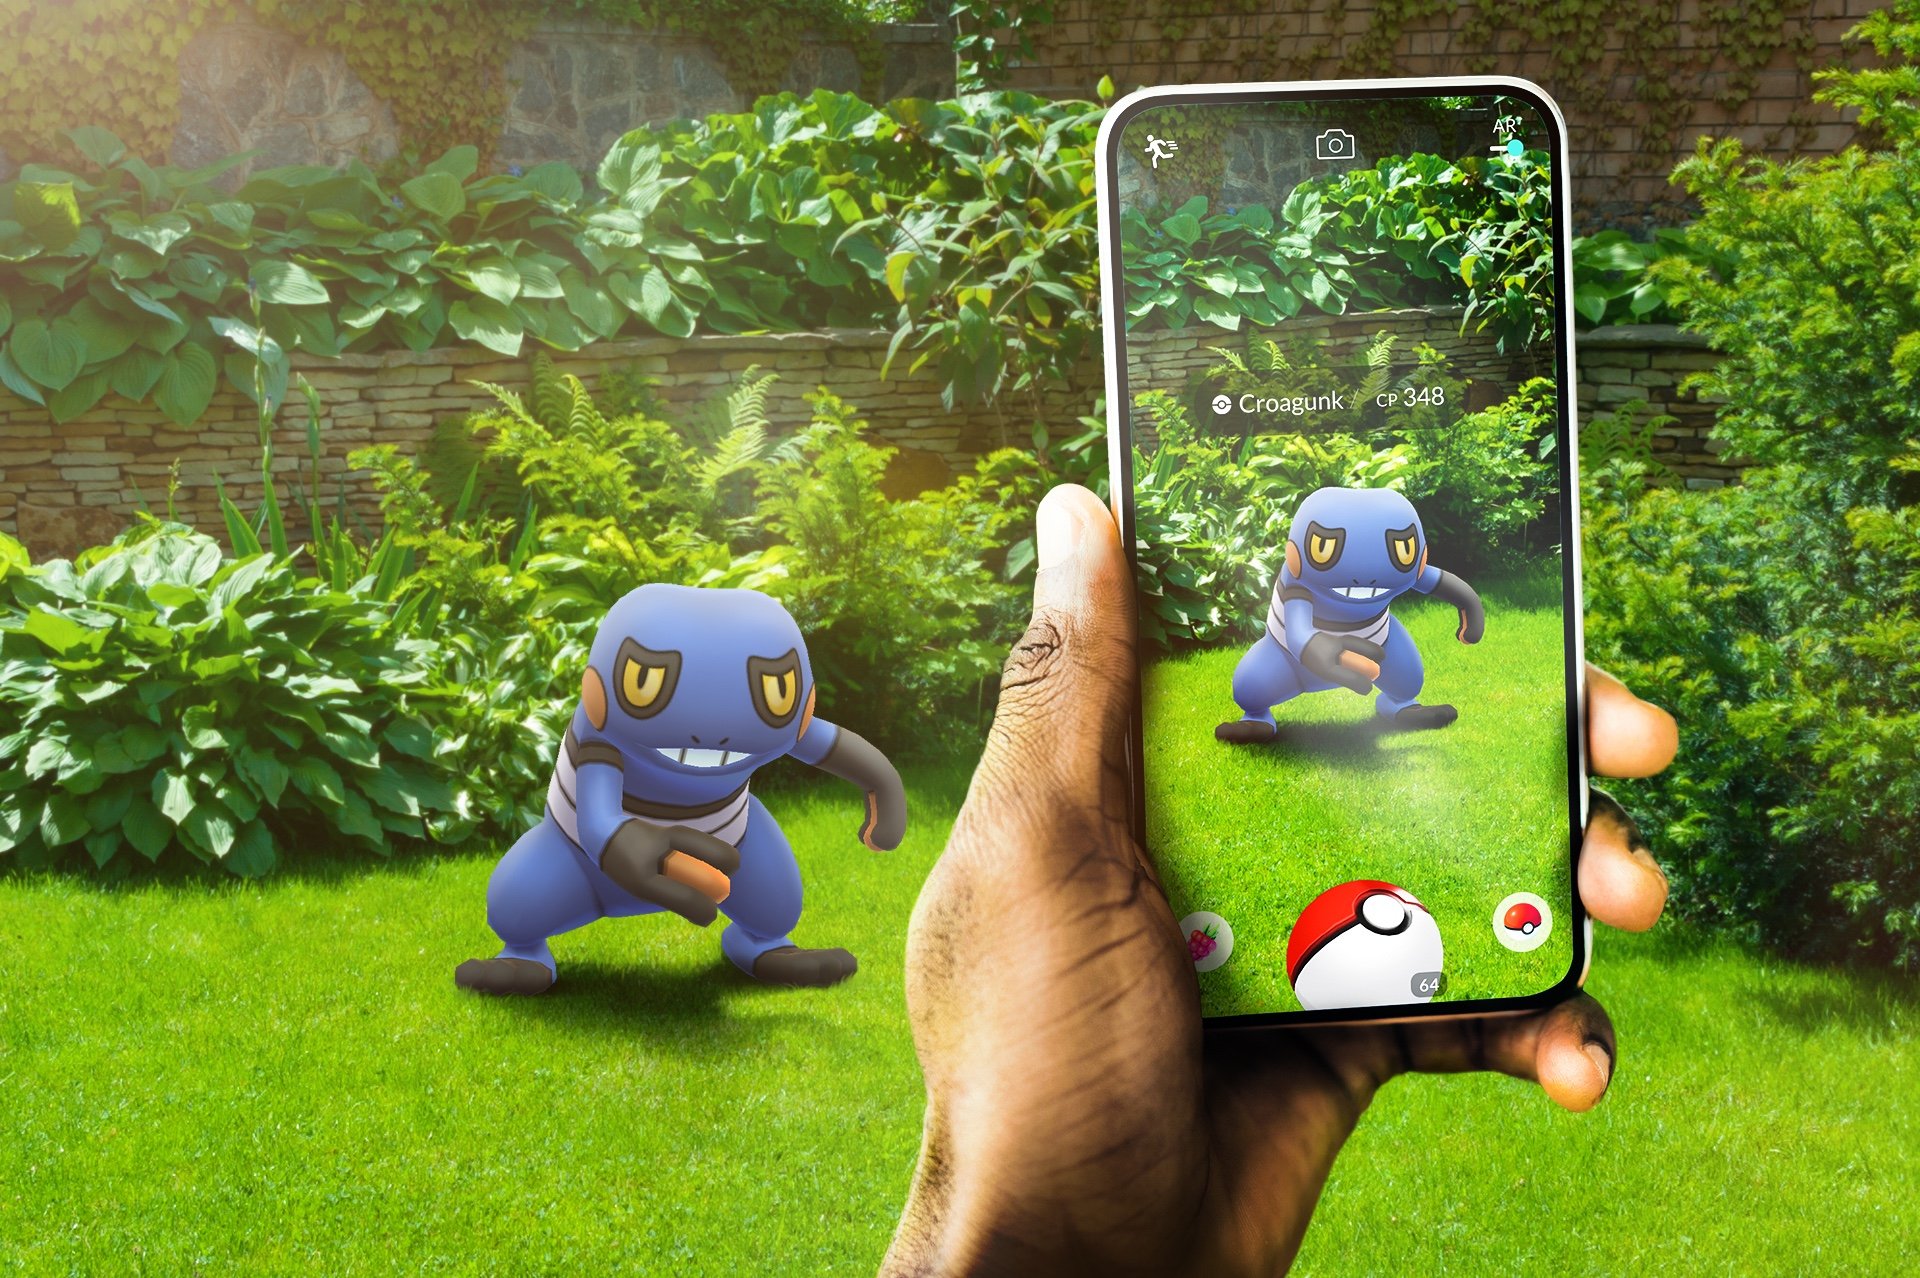
Niantic has long been a pioneer in augmented reality gaming, leveraging real-world exploration as its core mechanic. For those who experienced Pokémon GO’s 2016 launch, it’s not entirely an exaggeration to say it felt like the closest we’ve come to world peace.
Since 2018, Niantic’s flagship product faced an average decrease in annual active users of 16%. In this case study, we’ll break down the following:
Unpack the root cause of why the player base is shrinking
Build a plan for product improvement and revenue growth
Create metrics that accurately assess the success of our strategies

Before diving in, let’s first understand Niantic, the company behind Pokémon GO, and the unique advantages and challenges it faces.
Strengths
Powerful brand recognition. With 85% of mobile gamers recognizing Pokémon GO, Niantic benefits from one of the most well-known gaming brands globally.
Loyal community of fans. Pokémon GO unites gamers, Pokémon fans, and people who want to play with friends. How can Niantic continue to attract new users?
Expertise in geospatial data and AR. Niantic possesses extensive geospatial and AR data, but its full potential remains underutilized. Is the bottleneck a market demand issue or a technical limitation?
Weaknesses
Reliance on existing IPs. Are loyal Monster Hunter fans loyal to Niantic’s Monster Hunter Now? What share of product revenue does Niantic retain?
Declining user engagement. While Pokémon GO experienced rapid initial growth, its player base has steadily declined, and revenue has dropped alongside the decrease in users.
Brand distrust. Brand distrust is growing, particularly among ambassador users—dedicated players who recruit friends. Over-monetization targeting a small group of high-spending users risks alienating the broader player base.
The ultimate superpower Niantic wields is their combination of geospatial social experiences with an AR interface. Niantic has successfully built massive, up-to-date consumer datasets, offering a valuable foundation for future ventures. With a massive competitive advantage like that, what could be the root cause of their user churn?

tl;dr — Over-monetizing a player base leaves you with no players and no revenue. Instead we should focus on optimizing for delighted users while building a separate, hyper-valuable business using player-generated data.
Quick wins should never be overlooked, but there are second- and third-order effects to every decision. To understand this, let’s look at a hypothesis: will revenue increase if we increase the catch difficulty of Pokémon during raids?
First-Order Effects:
Raid Bosses are powerful Pokémon that appear in Raid Battles. Making them harder to catch will require players to use more Raid Battle Passes for the same result.
Second-Order Effects
Harder-to-catch Raid Bosses may push hardcore players to pay for additional attempts, but casual players might avoid raids altogether, leading to churn if they feel fatigued by the pay-to-play model.
Third-Order Effects
The gameplay loop is altered, and players are left with some new feeling from the user experience.
A savvy Product Manager will notice that increasing catch difficulty leads to higher churn rates, likely among casual players who are less likely to pay. Meanwhile, hardcore players may spend more on Raid Battle Passes. By adjusting catch difficulty, we can balance increased revenue with minimized churn. We might have a smaller player base, but we’ll pull more revenue per user.
A very savvy Product Manager will consider the third-order effect on the overall user experience: These changes affect the qualitative user value and brand perception of Pokémon GO. When multiple teams optimize for revenue significantly higher than player experience, the game can become less enjoyable, leading to player churn, community decline, and ultimately lower revenue.
Building Revenue Through Community
Software has radically changed, pushing innovation through tailored, intentional experiences. To thrive in this new environment, we must go beyond being useful—we need to build communities that connect with what truly matters to users.
Publishers can’t microtransaction our way to sustained revenue growth. From Star Wars Battlefront II to Overwatch, the graveyard of declining user bases is filled by ambitious product leaders who prioritized immediate revenue wins over user delight, ultimately losing both. Niantic has a unique opportunity to succeed in both areas by creating an incredible game which maximizes joy, while building a business-behind-the-business which maximizes revenue.

tl;dr — Pokémon Go users point their cameras at the world around them. This is special, and we can use the underlying data to build an enterprise product for on-demand imagery.
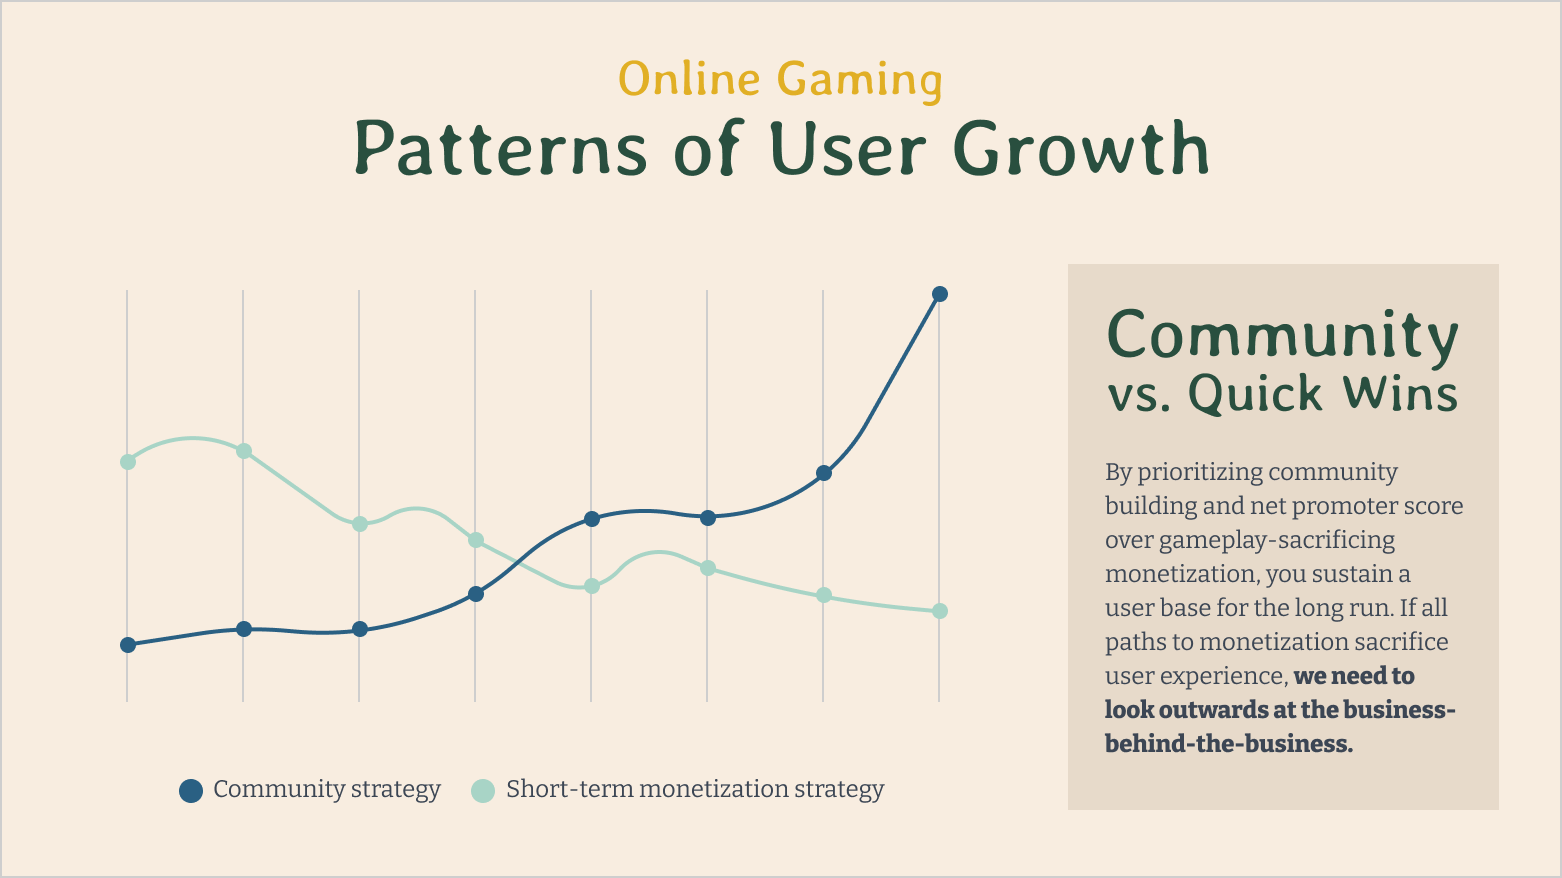
No game retains all of its players forever. As interest declines, servers shut down, and multiplayer communities fade. But many games die prematurely and lose the trust of their audience due to an eventual contradiction between revenue growth and game feel.
After a player base reaches equilibrium growth, revenue must continue to increase each quarter and the game experience is often sacrificed for it. Milestones are locked behind paywalls, advantages are given to pay-to-play players, and user monetization inches upwards. While enterprises have a tolerance for this extraction since upsells are usually value-generative, Pokémon GO players get value from delight. If you have to keep paying more for the same experience, what is sparking joy for players?
Resolving this contradiction requires driving two prongs: a delightful, high-engagement product, and a hyper-valuable business-behind-the-business.
Business-Behind-the-Business
To build a resilient community of players across multiple IPs who trust Niantic with their time, the product decisions should drive delight and net promoter score as north star metrics. Does accomplishing a specific game goal drive retention? Are players recruiting their friends to play with them?
Building a game community without a monetization strategy is a hobby, not a product. If we earn this resilient community at the cost of monetization, how do we build a business?
Niantic has succeeded in getting millions of people to walk to specific locations while sharing GPS data and pointing their cameras at the world around them, presenting two opportunities:
People walking & driving while having the app open → real-time foot traffic insights for retail analytics, urban planning, and insurance risk assessment.
People traveling to Raids & Pokéstops → more influence to mobilize people to a location for events or to drive business traffic.
People traveling to indoor Raids & Pokéstops → pedestrian pathways for last-mile delivery improvements and store floor planning.
People pointing their cameras at Pokéstops and Pokémon → crowdsourced, up-to-date imagery for property monitoring, retail compliance, or infrastructure assessments.
We’ll focus this case study on people pointing their cameras at Pokéstops and Pokémon, and how to build a hyper-valuable enterprise product that leverages this crowdsourced data.
RI(I)CE Analysis
We've discussed why user delight must take a front seat and that the community can generate data that is leveraged in some other revenue-generating way. We'll use RICE analysis to measure two key factors: community impact and enterprise viability.
Same-Day Imagery: Enterprise customers can request same-day imagery. This will prompt high-value Raids where users can point their cameras from specific angles to activate the event.
Reach: 2 — This affects most users and covers a wide swath of enterprise use cases.
Community Impact: 2 — Raids are joyful bread-and-butter features in Pokémon Go.
Enterprise Impact: 2 — Retailers, urban planners, and logistics firms could use same-day imagery for promotional compliance, pedestrian safety assessments, and last-mile delivery optimization.
Confidence: 2 — With ethnographic data on raids and brand intelligence companies competing to solve this problem, we can be fairly confident in this initiative.
Ease: 1 — The changes to the raid feature itself would be minimal, but a new platform would need to be built for collecting enterprise image requests and integrating it to the Pokémon Go app.
Total: 9
Regularly-Submitted Imagery: Enterprise customers receive regularly submitted imagery of a location to assess gradual changes. This will place a PokéStop or Raids to get users to point their cameras at a specific location.
Reach: 1 — While all users frequently participate in PokéStops and Raids, the span of enterprises who need recurring imagery is more narrow than those who need one-time images.
Community Impact: 2 — As with same-day imagery, Raids and PokéStops are delightful for users.
Enterprise Impact: 1 — From retailers doing compliance monitoring to telecom companies needing regular infrastructure inspection,
Confidence: 3 — The game features are well-established, and the enterprise use case is already established through competing products.
Ease: 0.5 — Balancing mechanisms will need to be created to ensure players are submitting imagery enterprise customers need in the needed time frame, and a new enterprise product will need to be built.
Total: 7.5
3D Space Modeling: Enterprise customers can request a 3D model of a location. Rare Pokémon Chases can involve players moving to different locations and moving their camera around to catch a rare Pokémon. These images can be stitched to generate a 3D model of a physical location, including indoor spaces.
Reach: 0.5 — 3D models are a niche enterprise need, and since it is a highly-involved process, fewer players will participate unless the reward is very high.
Community Impact: 0.5 — This is a highly-involved process, and the experience is unlikely to feel organic as part of the game.
Enterprise Impact: 2 — Photogrammetry of physical spaces costs thousands, and crowdsourcing this process can drastically cut costs.
Confidence: 1 Developing this feature without sacrificing game feel will be challenging, but the enterprise need is significant.
Effort: 3 — A new, fairly complex event type will need to be created in the game, and processing the images into a 3D model will involve building a complex enterprise product.
Total: 7
Let’s focus on Same-Day Imagery as a potential feature. This analysis is focused on finding solutions to problems, but the process of validating whether this is the best feature set involves creating rapid experiments to gather signals for value. Here are potential signal-building strategies:
Lock in five Letters of Intent with enterprise customers to verify use cases for same-day imagery. Which customer segments are most enthused for reliable location imagery? How tolerant are customers of delays in crowdsourced images? How much do they pay for existing solutions, and how much are they willing to pay us?
Perform multivariate testing with raid rewards. How do different rewards affect the time it takes for people to go to a raid and point their camera at hotspots? Can we build probability confidence intervals for how quickly we can get N participants to a raid in different regions with various populations?

tl;dr — We can measure enterprise success by winning and retaining customers, and we can measure product success on whether players are participating in high-value raids, and if the images they take are what enterprise customers want.
Success is often lost in the vibes, leading to inaccuracy in assessing signals. Before creating an experiment, we need to dial in to a set of metrics that we can chase to measure success. For same-day imagery, we’ll know success through two dimensions: success in generating the images through Pokémon Go, and success in earning and retaining enterprise customers. Let’s explore how to turn these into signals we can monitor.
Success in generating images
Are players successfully mobilized to partake in high-value raids? We’ll need to compare what players would do instead of high-value raids, which might be raids overall. This is our north star metric, with the other metrics being auxiliary, since our initiative relies on high-value raid participation. Here is one way to measure high-value raid participation:

Are the images what the customers are looking for? Once a customer receives the images, we can ask for feedback, but the feedback will only be a segment of the total sampling frame. Instead, we can create a success metric to understand value, and a failure metric to understand friction.
A success metric could be the number of times a customer exports the images they create.

And a failure metric could be the number of times a customer takes no action or requests a redo after receiving their images.

If we find there is friction in the image generation, we can build other metrics to measure the ratio of revising images versus giving up and the abandonment rate.
Image Fulfillment Problem
Another critical metric which should be communicated to customers is knowing estimating the time until an image request will be filled. We can use statistical modeling based on historical data to create this estimate and share it with a customer, similar to how rideshare platforms provide an estimate for how long it takes to obtain a driver.
Our target variable is the time taken for a request to be completed, and we might use the following independent variables as predictors:
Reward for image generation
Population density of the area
Time of day & day of the week
Historical fulfillment times for similar requests
Weather conditions
We can start with a linear regression and work with the data team to experiment with different models to improve accuracy.

Product Note — While we can use Fulfillment Time as an internal metric, our product offering should share a separate estimate before the request is made. We would want to understand the use case to find the best interval, but we can use a survival analysis to find probabilities of fulfillment time using our historical Raid dataset. If we say our interval is 95%, when a customer is on the last step of an image request, we can share Estimated image fulfilled in T hours where T is the 95th percentile of historical data for similar requests.
Enterprise Success
While the opportunity for building new products is contingent on Pokémon Go’s data, the success of the business is contingent on whether the enterprise products being built provide value. We can measure this very directly using three metrics:
Average New Customers / Month
Average Deal Value / Month
Contract Renewal Rate / Month
If contracts are secured on an annual basis, its mission critical to receive signals from enterprise product metrics as well as qualitative insights from the sales or customer success teams. A customer might be lost this month, but the decision to drop could have been made months ago and might not be reflective of current decisions.
The future of Pokémon GO hinges on Niantic’s ability to maintain an engaging player experience while unlocking new revenue streams through its unparalleled geospatial and imagery data. The right balance will determine whether Pokémon GO remains a cultural phenomenon—or fades into nostalgia.